Story Points: Agile Estimation Essentials With Agilonomics

What are Story Points and how to work with them?

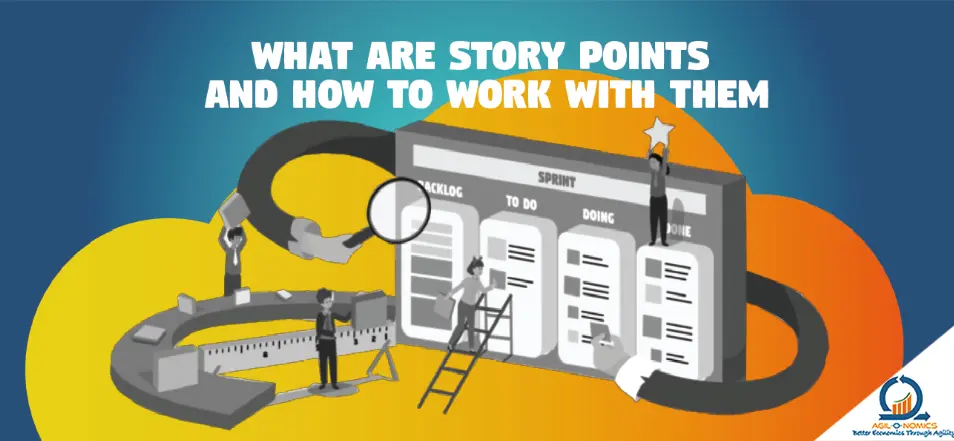
Story points measure the estimated effort needed to complete a work item, serving as a standard unit of measurement for comparing and estimating different items. They help teams plan and prioritize work more effectively by providing a better understanding of the overall effort required for a project or sprint. Story points’ actual values are not important when estimating work; what matters is the relative values assigned to each item. Different teams may use different value sequences, but the ratio between the values is key. By focusing on relative values, teams can get a more accurate estimate of effort for each work item. According to Mike Cohn, Story points allow teams with different skill levels to collaborate and reach a consensus on estimates. They avoid disagreements by focusing on the relative effort required for each item, instead of debating individual team member’s completion time for a task. By using story points, teams establish a shared understanding of the effort needed for each work item. “How to Calculate Story Points in Agile Projects” The primary definition of story points is that they measure the amount of effort required to develop a user story or product backlog item. Effort is synonymous with time and is determined by several factors, such as the quantity of work, the intricacy or complexity of the work, human factors and any potential risks or uncertainties involved. When estimating with story points, the complexity, effort, risk, and volume all come into play. However, in the end, the story points provide an estimate of the required effort. Let’s explore major factors that influences the story point estimation. Below are examples provided for each factor to help with understanding. 1. Quantity/Amount of work Let’s consider the case of two user stories for a software application. The first user story involves creating a simple login page with just one field for entering the username and password. The second user story involves creating a more complex user profile page that allows users to upload a profile picture, update personal information, and view past transactions. Although the login page is simple, there is still work to be done in creating the backend logic for authentication and storing user information securely. On the other hand, the user profile page involves more complex features that require additional backend and frontend development effort. Therefore, the user profile page should be given more story points to reflect the additional effort required to develop it. It may not necessarily be assigned double the story points of the login page, but the ratio should reflect the approximate relative effort required. 2. Work intricacy/complexity Now let’s say the login page needs to have additional functionality, such as the ability for users to reset their passwords. This functionality requires the development team to create a new page that guides users through the password reset process. The password reset page is more complex than the login page, as it requires additional logic to ensure that users can successfully reset their passwords. Additionally, there may be more risk involved if the password reset process is not implemented correctly, as users may become frustrated and abandon the application if they cannot reset their passwords easily Given the added complexity and risk, the password reset page should be assigned more story points than the login page. However, the relative number of story points assigned should still approximately reflect the difference in effort required between the two pages, allowing team members to effectively communicate and agree on estimates. 3. Risk, Uncertainty When estimating story points for a product backlog item, the amount of risk and uncertainty should be taken into account. For example, if a team is asked to estimate a login page feature and the requirements are unclear or not fully understood, this uncertainty should be reflected in the estimate. Another factor to consider is the potential risk involved in implementing certain features. For instance, if the login page requires integration with a third-party authentication service that the team has no prior experience with, there is a higher risk of unexpected challenges or delays. This risk should also be reflected in the story point estimate. In summary, when assigning story points to a product backlog item, it is important to consider any risks or uncertainties involved in its implementation. This can help ensure more accurate estimates and better planning for the team. Combining all three factors into a single effort estimate can be challenging, but it provides a more accurate estimate for sprint planning. What is “The definition of done in Agile” ? It’s essential to remember that a story point estimate must encompass all the work required to complete a product backlog item, including those necessary to meet the definition of done. For example, if a team’s definition of done includes developing and running automated tests to verify that the story has been implemented correctly, then the effort required to create and run these tests should be taken into account when estimating story points. Incorporating the effort needed to satisfy the definition of done into the estimate helps ensure that the team can meet its commitments and that the product backlog item is fully complete at the end of the sprint. This also helps to avoid any last-minute surprises that could impact the team’s ability to deliver high-quality work. Human Factor – The Importance of Conversations in Agile Estimating Agile estimating requires conversations to achieve accurate and reliable story point estimates. Despite using story points as a method of estimation, team members may initially disagree on the effort required for a particular product backlog item. Conversations during estimation allow for exploration of acceptance criteria, approaches, and other factors that impact the effort required to complete the item. These discussions increase the team’s understanding of the work and can highlight assumptions and gaps that the product owner can investigate. Planning poker is a recommended method for agile estimation, as it ensures individual estimates are kept private until all team members reveal their cards. This approach reduces

Gauge project speed and progress with this essential metric in agile development with Agilonomics.

What does Velocity represent in Scrum?

Agile team members work together to groom, plan, commit, and deliver work every sprint. The number of story points that a team delivers in a sprint is known as velocity.  Velocity Definition Velocity is thus a measure of the speed (ideally, expressed in story points) at which an agile team delivers work every sprint.  Who invented velocity in Agile? Velocity was invented or created to help the teams feel empowered and self organized.  Ron Jeffries, one of the 3 founders of XP (extreme programming) explains that the concept of estimating using “ideal days” got confusing to people. An “ideal day” is defined as a day of work without any disruption.  Acknowledging disruption, they would multiply “ideal days” estimate by a “load factor” to translate the (ideal) effort to real (time) effort. So, an effort of 1 “ideal” day” with a “load factor” of 3, would mean 3 ”regular“ or ”real“ days of effort.  However, while continuing to estimate using “ideal” days, the word “ideal” was ignored (not spelt out) but assumed in the team discussions and stakeholders failed to catch that. You can imagine how it could have created confusion when a team was estimating 1 “ideal day” (but actually meaning 3 real days) of effort, and stakeholders assuming it to be 1 day of effort but not finding work complete on time and complaining about it! This is where Ron and team started using points instead of days referring to 3 “ideal days” as 3 points and meaning 9 days of effort and so on… Thus a team finishing a certain amount of points in a timeboxed period came to be known as velocity (speed) Wise use of velocity Velocity is an important metric, if used wisely and understood properly. Unwise use or abuse of velocity creates issues and leads to teams and leaders wanting to avoid using it. Velocity numbers may increase organically as a team becomes stable in its composition and consistently grooms, estimates, and swarms together. Such an increase in velocity should be a welcome thing. When teams are pushed for increasing their velocity or velocities are compared between teams, it can create wrong habits and anti-patterns. This is where teams sometimes start what is known as “story point bloating” (Giving more points to stories to show an increase in velocity). This is one of the sad things to happen and contributes to fake Agile and people wanting to avoid Agile and Scrum For teams that swarm together and work to finish their team commitment as a unit (“All committed work is ‘our’ work and not mine vs. yours”), their process efficiency increases and may lead to an organic increase in velocity. Such an increase in velocity is a win-win as it shows the value of Agile done wisely and brings value to teams, users and customers. You will notice that for most teams the average process efficiency is quite low (less than 5-10% or lower) Even a 10% increase in process efficiency can have a good impact on velocity. Stable velocity and high predictability are important ingredients of an Agile release plan How velocity is misused and abused? A good team works to establish a stable velocity range along with high predictability. These are important ingredients for a team to plan their releases. The knowledge of previous (Sprint) velocities, along with clarity on (next Sprint) availability (team capacity) of team members helps the team plan better in the upcoming Sprint.  A number of factors can prevent a team from establishing a true and organic stable velocity range. Some of these factors are: When leaders do not understand deeper agile values and principles, lack servant leadership,  tend to track or compare velocities of teams, they create environments where teams feel unsafe, carry mistrust and fear.  This results in creating negative and unhealthy pressure which results in abuse of velocity. Teams feeling under pressure tend to manipulate the story points, to show higher velocity. This is indeed a sad thing to happen and is highly detrimental to the foundation of Agile Leadership and management must be educated and coached to never compare velocity charts or numbers of teams in order to avoid slipping into the above habits and anti patterns Velocity and Predictability  Predictability is defined as the number of points completed from the committed ones. Like Velocity, Predictability can also be abused. Remember, good teams use metrics to validate how effective they are instead of putting(fixing) data together to show great metrics! Total committed points are usually committed towards the end of the Sprint planning meeting. A team that works effectively, is empowered and supported by their leaders and grooms, plans and commits as a unit is likely to complete most of its commitments.  When teams are not yet effective, it is common to see scope changing throughout a Sprint and even if the team may have finished “number” of points equal to what it committed during Sprint planning, they may not be the same stories (or story points) as planned due to the change of scope after Sprint started.  When such behavior repeats, it becomes a habit, and an anti-pattern. Eventually, the true meaning of predictability is lost and planning falls apart.  A good coach will work with the Scrum Master and developers to help them understand organic ways to account for unplanned work and may suggest using Kanban (instead of Scrum) if there is too much disruption to planned work repeatedly. Teams that have swinging  velocity will most probably struggle to have a high predictability consistently due to lack of ownership and accountability resulting in little collaboration and swarming Velocity myths and facts 1. Is velocity the only way for making forecasts and planning releases? Not really. Throughput, which is defined as “number of backlog items completed in a given timebox (such as a Sprint)” may also be used for planning and forecasting.  However, the issue here is that “number of backlog items” are not always of the same size and so it tends

Story Point Hours: Agile Estimation Measure By Agilonomics

How many hours does a Story Point equal to?

Story points were meant to be abstract. This abstraction helped bring a discussion back to work (size, complexity, bigness, etc.). In the absence of story points (in the earlier days), people would often argue about hours, leading to a lot of emotions around time.  A real time scenario between my Boss and me is presented below (took place many years ago): Boss: Amit, here’s a new project [explains for 3-5 mins…].. How much time can you complete this in? Me: Boss, you just laid it out, at least give me a day to think it through Boss: We need to respond today, $3M are at stake Me: [Confused and frustrated] How about 2 years Boss: [Almost in anger] You will lose your job and I will lose mine too! […the argument continues for the next 60 minutes. ] Finally: Boss: So we agree it can be done in 6 months right? Me: [With a defeated expression…] OK Project was finally completed in 10 months. Low quality, frustrated team and unhappy customers.. Coming back to the point: When I learnt and understood Story Point estimation and how to use them effectively, the same situation resulted in discussing work, whenever there was disagreement on a large work estimation(e.g. project estimation = 300 points). If understood correctly and used wisely, story points and how they relate to hours can be a powerful tool for Agile teams to help improve their estimation accuracy. Let me try to explain this point (the relationship of Story Points vs. Hours) with an actual scenario below In the image that I have presented below, you can see how team members can reflect on the past estimations and relate to the amount of time spent on different stories.  Feedback from such data has helped my teams improve their understanding of estimations, and have powerful conversations leading to estimation accuracy. Understanding how to use this artifact: Y axis – Relative Sizing(Story Points) X axis – Time ( Hours) After completing 4-6 sprints with a team, I would plot this data and would organize an estimation retrospective with them. Such data provided deep insights –  1. One was on how different story point (SP) ranges compare to each other in general. New teams often found that the SP to Hour ranges were long and that there would be huge overlaps with adjacent SP ranges (shown in red circles in image 1) 2. They also noticed that there were a number of odd stories – the ones that would penetrate deeply into the next higher or lower SP range. These needed more conversations and better understanding. (marked with red circles) 3. The team would then identify similar stories in the upcoming or future sprints and often re estimate them after conversations 4. This helped evolve the Story Point to Hour ranges to be more compact and they overlapped more towards the edges (As shown in green in Image 2) This journey took some effort and time but brought in huge rewards and increasing understanding about wise usage of story points and how they relate to hours  I hope you can apply this to your own work and benefit from it.

Know scrum effectiveness with Agilonomics

When is scrum most effective?

Don’t use Scrum when you don’t need to!In fact, Scrum isn’t supposed to be effective for every type of development. Many teams and organizations use Scrum without understanding when and where it is most effective. It costs them time without much impact on added value or creativity Scrum comes with overheads – The Scrum Events consume time and come at a cost! Why would you want to do Scrum when your inputs are simple and outputs are same every time? The Cynefin model (image1) is a sense-making model and provides deep insights into where and why Scrum fits best At any point in time, you are in one of four possible circumstances (each represented by a quadrant or domain) described below If you don’t know which one you’re in, then you’re in Disorder. Domain1: (Lower Right) – OBVIOUS  Things are CLEAR and KNOWN:  Cause(inputs) and effect(outputs) have a direct relationship Tightly constrained; No degrees of freedom Practice: Sense -> Categorize -> Respond (best practice, when possible) Example: Manufacturing Process Model. Using assembly line to combine parts to create the same product each time Remember: #AgilePrinciple#10 Simplicity – “The art of maximizing the amount of work not done is essential. So, why introduce process when it becomes an overhead? Domain2: (Upper Right) – COMPLICATED  Things are “KNOWABLE” Cause and effect have an indirect relationship understood through analysis. The relationship holds true to some logic each time Governing constraints; Tightly coupled Practice: Sense -> Analyze -> Respond (Good practice when Simple is not possible) Example: Your car stops working, but each time, the mechanic figures out through analysis Domain3: (Upper Left) – COMPLEX Things are “UNKNOWABLE” Retrospecting may provide a way to manage and improve Enabling constraints -> Loosely coupled Practice: Probe -> Sense -> Respond (Emergent practice) Example: Weather, Stock Market. Predictions can often go wrong; Software Development usually falls in this category Domain4: (Lower Left) – CHAOS  Things are “TURBULENT” and appear “UNCONNECTED” No relationship between sense and respond at a systems level Practice: Act -> Sense -> Respond Lacking constraint; De-coupled Novel practice is the need Example: When COVID first struck. There was utter “DISORDER” We witnessed: Cynefin teaches us a lot. Whenever there is disorder, it resolves into one of the 4 quadrants. The path is usually CHAOS -> COMPLEX -> COMPLICATED -> SIMPLE

A Fool With A Tool Will Still Be A Fool

Having worked in the Agile space for many years, and having experimented with so many ideas including processes, tools and work dynamics between people, I’ve come to realize that although the tools are important, they are not enough by themselves in creating effectiveness at work. A lot of people in the corporate world think that getting a tool will make them more agile (or more effective). This is a misconception. A lot of the time, executives at different companies have even told me things like “now that we have Jira installed, how soon can we be agile?” At Agile conferences, companies set up booths to showcase their products to conference participants. It is very surprising to see how often they try to convince people visiting their booths to buy a particular tool, which will help their teams would grow significantly in their Agile journey. This is not true!  Even our own Agile Manifesto speaks about this through the first value: “Individuals and Interactions over Processes and Tools”. What does it mean? It means that success and failure are first and foremost about people. If you succeed with people, you will succeed with your products, projects and processes. However, if you fail with people, you will struggle with your products, projects and processes. You can see how such a concise yet deep statement helps bring clarity on where your primary focus should be. It is very much possible to have a great self organizing, empowered team with below average tools performing better, having higher levels of happiness and bringing greater value to the end users and customers than teams that boast of the best, state of the art tools but hardly understand what working as a team means. Agile seems to thrive most in those teams who employ low-tech/high-touch tools. Examples would be a wall scrum board in your team space. Such tools radiate information (a.k.a. ‘Information Radiator tools’) creating high visibility and encouraging swarming and dialogue between team members. They are so visible that they speak volumes to the senior leaders and executives on the state of how the teams are doing. Compare these to digital tools (a.k.a. ‘Information Freezers’). They have all the information inside as in a freezer, similar to where you store food, but you only see them when you need them. However, the low-tech/high touch tools are easily accessible to you like items organized on your counter. They are highly visible and much more useful to Agile teams. I am not opposed to using digital tools, but relying solely on these tools can actually reduce Agility. Another issue with these digital tools is that although they make you efficient, the efficiency comes at the cost of effectiveness. And there’s a difference between the two (efficiency vs. effectiveness). For example, in our olden days we used to do our backlog grooming and story writing on index cards and place them on the wall. We used only write enough index cards to describe the entire product, but only the cards at the top were described in detail (small enough to fit in the next sprint). These were the items of highest value going into the next sprint, and were the items that the team could fit within its capacity. All the cards below were large user stories, epics, and so on. These days you have digital tools such as Jira, VersionOne, Rally, etc. that help manage backlogs. Teams use these to write hundreds of stories without understanding the whole product. As a result, they lose sight of the big picture. A lot of time is wasted going into those stories and the teams work hard on creating outputs rather than focusing on outcomes. Do you see how effectiveness was compromised at the cost of efficiency? What is the benefit of working this way? None, really. Instead of working to deliver their stories or functionalities that are most valuable to the end user, that time is used in writing stories that might never be needed in the future. Additionally, loss of this time due to context switching is pure waste. It takes away time from delivering the current committed work to writing more stories for the future. Wise agile teams that use digital tools should keep the basic foundations of Agile – the Agile Values and Principles, in mind. It will help bring a balance between the need for using only the right tools and the tendency of overusing those tools.  There are three aspects of tools: What do I mean by the third aspect? Because these will be such times when the tool will be unable to satisfy your needs and waste your time in the process. I usually say “a fool with a tool will still be a fool unless they have been educated to understand the second aspect of using the right tool effectively”. Here is an example: To round it up, be wise when it comes to using tools. Understand the need. Do your research to acquire the right tools. Get the right people to understand how the tool can help you satisfy your needs. It should involve training, coaching, experimenting, inspecting, and adapting, before you settle down. How do you feel about using tools and their role in creating a more Agile team? Amitabh (Amit) Sinha is a servant leader entrepreneur, visionary, mentor, trainer and coach. Amit is highly passionate about Agile, its principles, values, and the human side. Amit is a people champion and strives to bring out the best in his teams. Amit leverages his expertise in Agile, Scrum, Kanban and people skills to increase team effectiveness and happiness. See more

Transform Your Team, Elevate Your Business!

Subscribe to the Agilonomics Newsletter and Claim Your Free Power Team Consultation Today!

We promise to keep your email address safe. You can check our Privacy Policy.

Thank you for subscribing to our Agile Wisdome - Weekly Tips!

You’re almost there! Please check your email and click the confirmation link to complete your subscription. If you don’t see the email, be sure to check your spam folder.

Privacy Overview

This website uses cookies so that we can provide you with the best user experience possible. Cookie information is stored in your browser and performs functions such as recognizing you when you return to our website and helping our team to understand which sections of the website you find most interesting and useful.

Strictly Necessary Cookies

Strictly necessary cookies are enabled at all times so that our website can function optimally.

3rd Party Cookies

Our website uses Google Analytics to collect useful information. These cookies are used by us to build a profile of interest and show you relevant offers.

Keeping these cookies enabled helps us to improve our website and your experience.